Hi, I was going through the observability section of the course and it’s not very clear for me the difference between Prometheus and Jaeger. Prometheus is the TSDB and it also provides the UI in which one can filter by event.
However, in Jaeger the same happens, one can filter by event. The only different I see is that with Jaeger one can see the time of the requests in each step of the whole process.
Is this true or there are more things I’m missing ? in many cases both tools could be used ?
KR,
David
Hi @hyakunin
They serve different purposes, so there no reason why you can’t deploy both.
Have a look at Jaeger vs Prometheus - Key differences, use-cases and alternatives | SigNoz
Hi @Alistair_KodeKloud
thanks for the link.
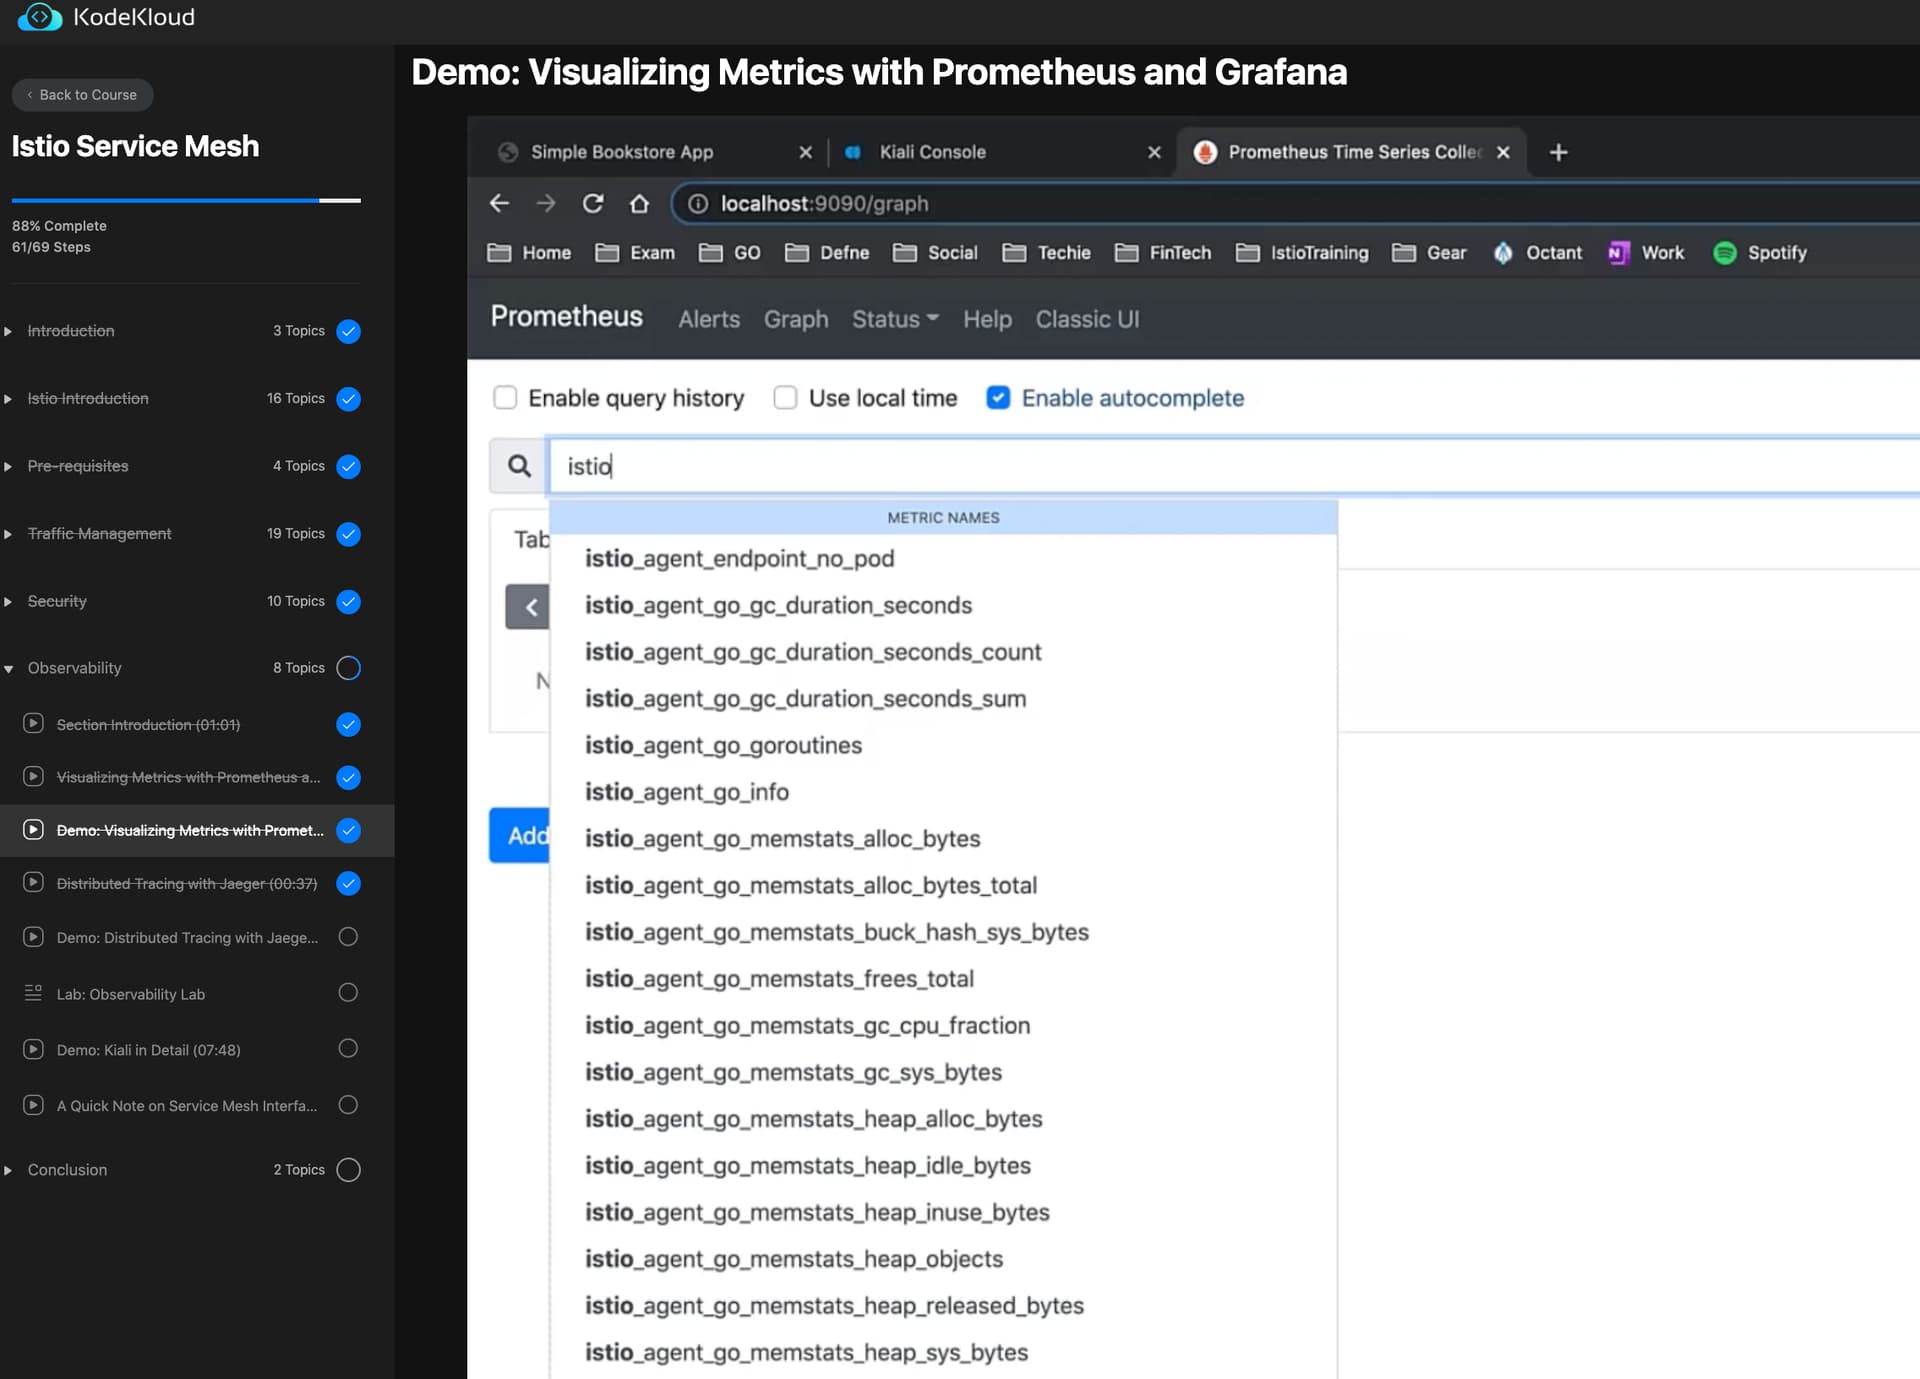
what I don’t get very well is the difference from what I see in the course videos:
while in Prometheus it can be seen that those are events presented by Istio, I don’t get quite well what is Istio or Kubernetes presenting to Jaeger…
in Promotheus the events have underscores in their names while in Jaeger the traces names have hyphens
KR,
David
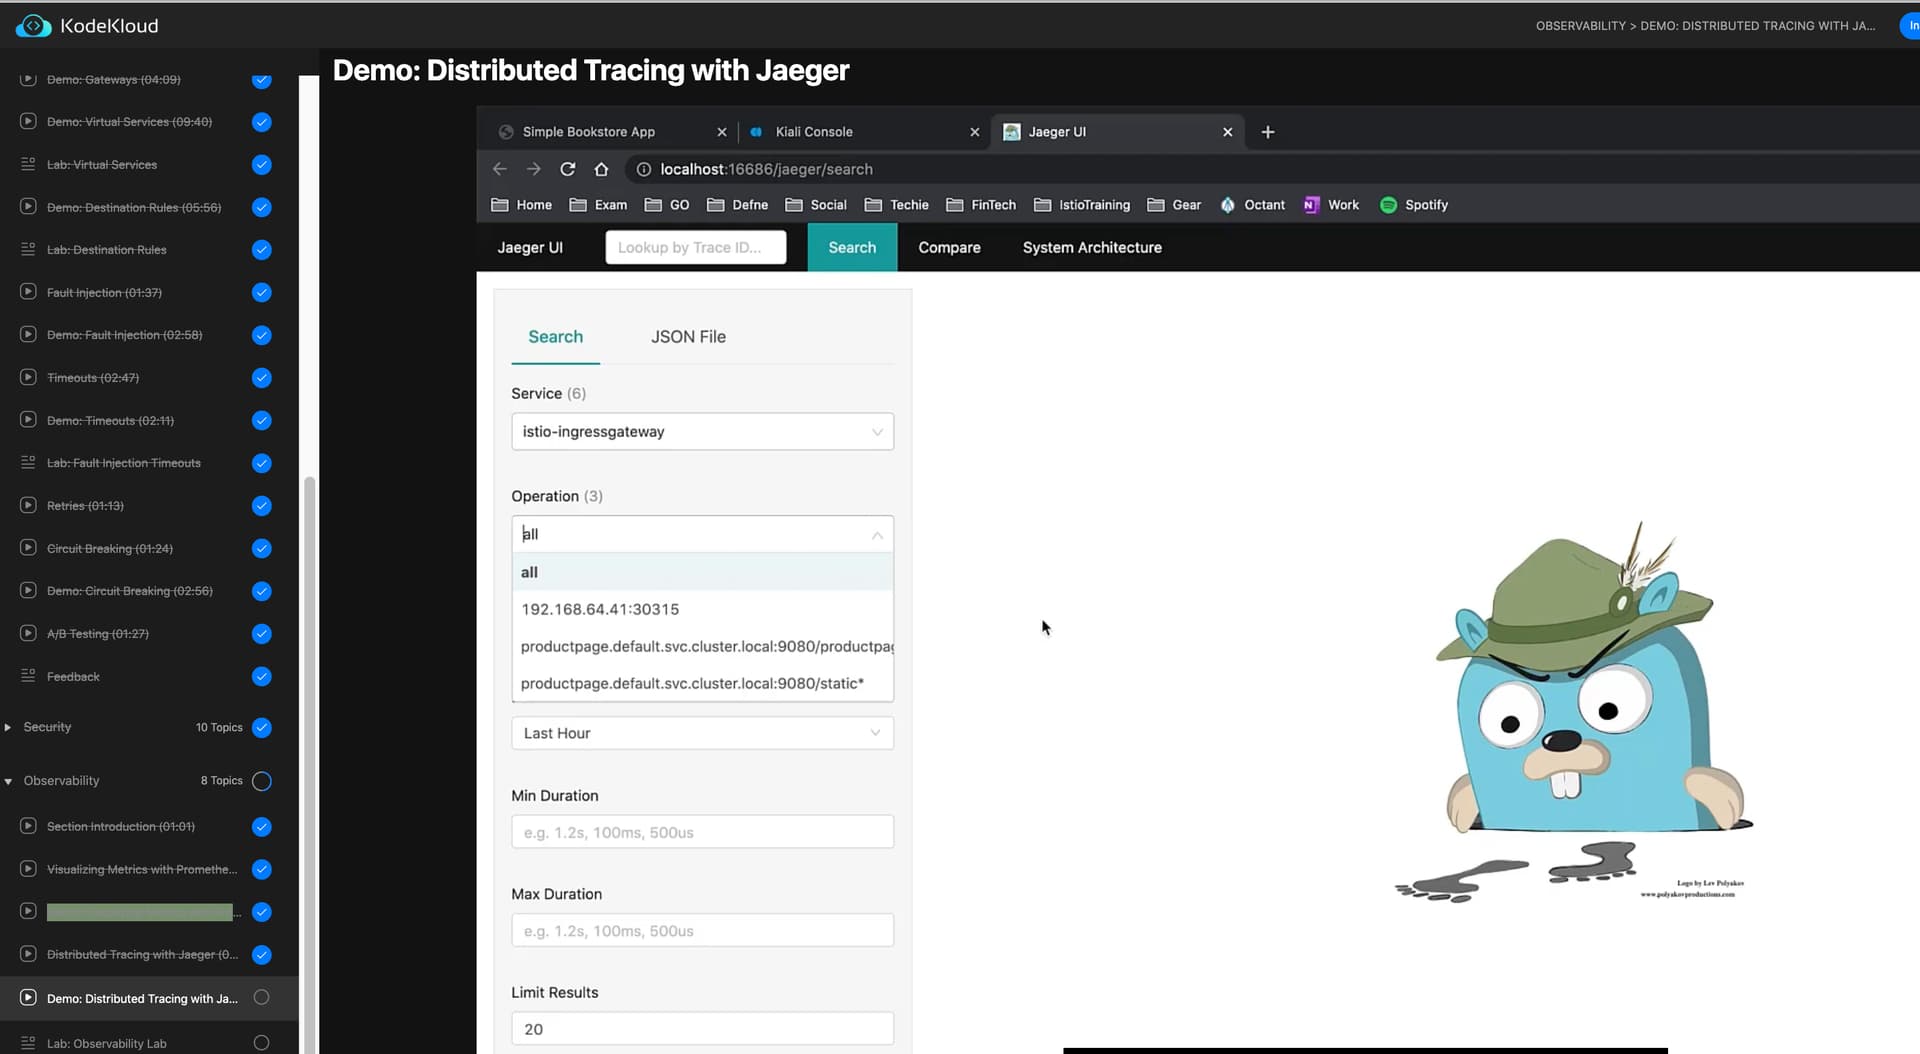
here I put the capture of Jaeger as I can’t attach two images in the same comment
The Istio envoy proxies produce two sorts of data
- Metrics - These are simply measurements of things like memory, disk usage, CPU usage, number of requests handled per second etc. The cluster itself also produces metrics when the Kubernetes metrics service is installed (see
kubectl top pod etc).
An application developer can use the Prometheus API to add custom events to metrics outputs based on some internal values in the application which the developer thinks would be useful to have logged. For instance if you implemented your own cache instead of using something like redis, you would output metrics such as cache hit %.
Prometheus is the tool used to collect, store and query these metrics.
Grafana is used to better visualise the results collected by Prometheus.
- Traces - In this context, a trace follows the path of a request (somebody calling the application from a web browser) through the components of the application, so you can look for latencies within each component of the application. The trace output is much like the network tab in Chrome’s developer tools - which traces the interactions required to render an entire web page (fetching CSS, images etc). If you have an application in the cluster that uses several different microservices to produce an answer, you can see the interaction between them, e.g. how long the product page is waiting to get a result from the reviews service.
Jaeger is used to collect and visualise these traces.
1 Like