This issue was missed somehow earlier and recently came into notice so its already been reported. We are working on it already.
@neroxxpips you should have today’s task already.
This issue was missed somehow earlier and recently came into notice so its already been reported. We are working on it already.
@neroxxpips you should have today’s task already.
Good to hear can i get those two missing tasks with one for today as well ?
You can look for detail in link I attached.
Got it, thanks for the support.
@Inderpreet, Same thing also happened to me. I didnt get my regular task when @rahul456 maked success of my “time check pod” task. I got the new task after 24 hours after making old task success.
@Inderpreet, @Ayman, @rahul456,
Getting following error, not sure what I did wrong , can you check and let me know ?
Thanks.
Hi @rahul456,
No, I received it yesterday 16/08 14:03 CET. I completed the task tis afternoon 17/08.
Regards,
Dirk
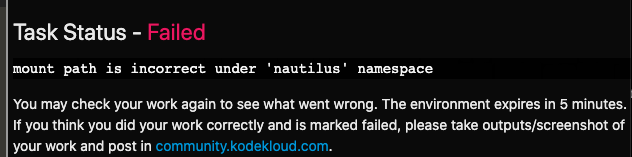
I attempted this task now and at the end the FINISH and TRY LATER both options didn’t work for me. And finally, it marked as failed for me once i refresh the page. @rahul456 can you please help on this.
My KKE is Mohamed Ihsan
I have done it through review. My execution is succeeded but unfortunately, I miss half marks due to the technical error.
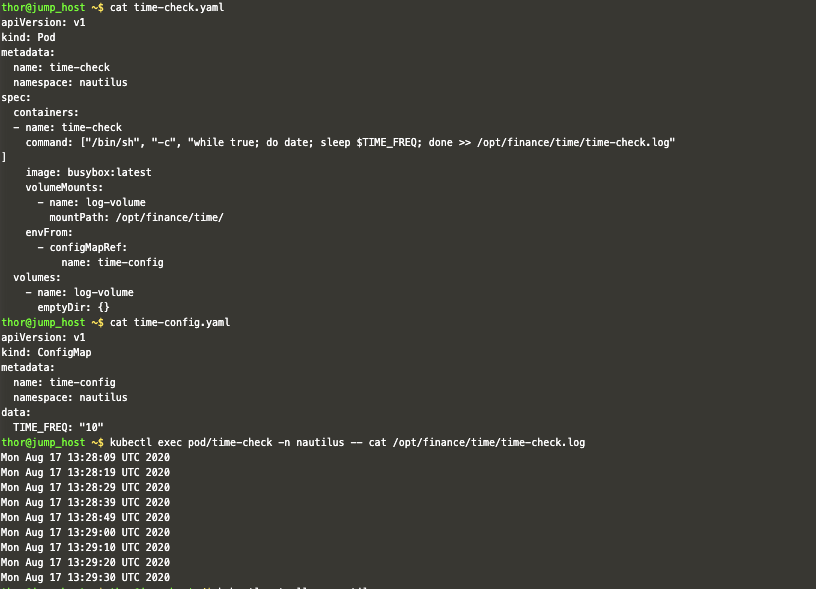
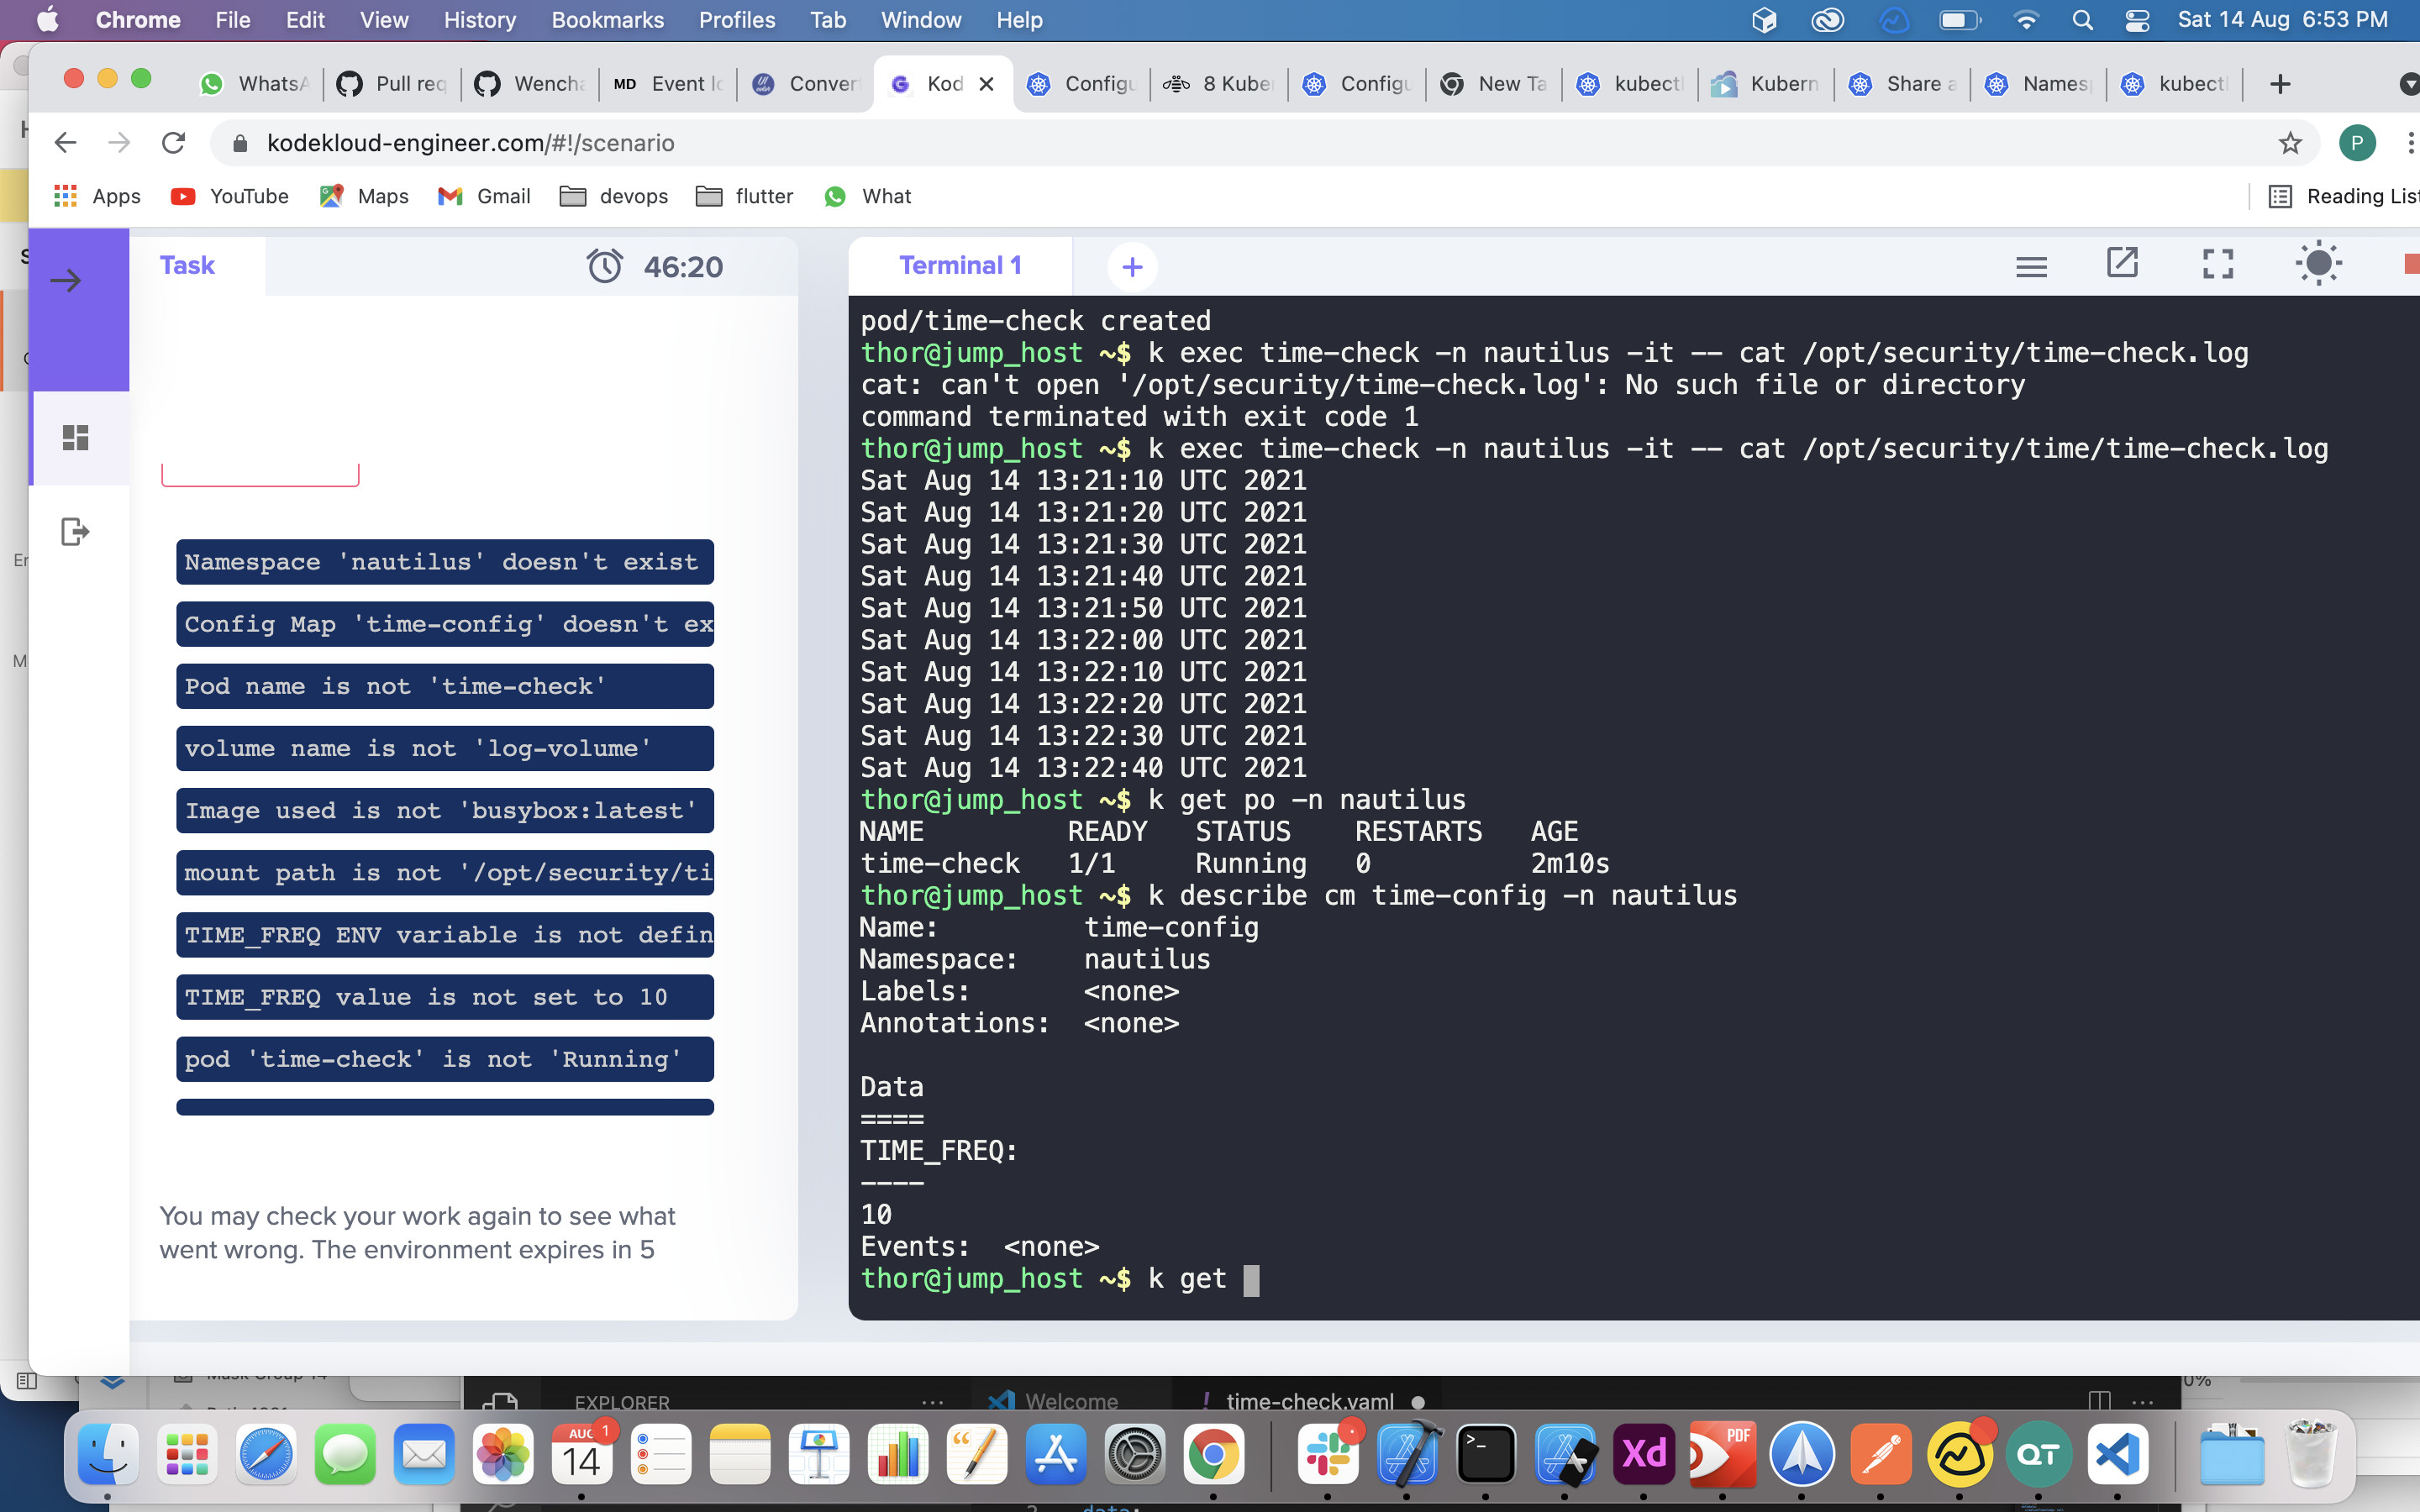
I have one concern, Is the “TIME_FREQ” variable intended to limit the output? In my case (and I see on others as well) the output continues yet the task was a success. Is it correct? Or are we missing any?
@rahul456@kodekloud@Inderpreet@neroxxpips
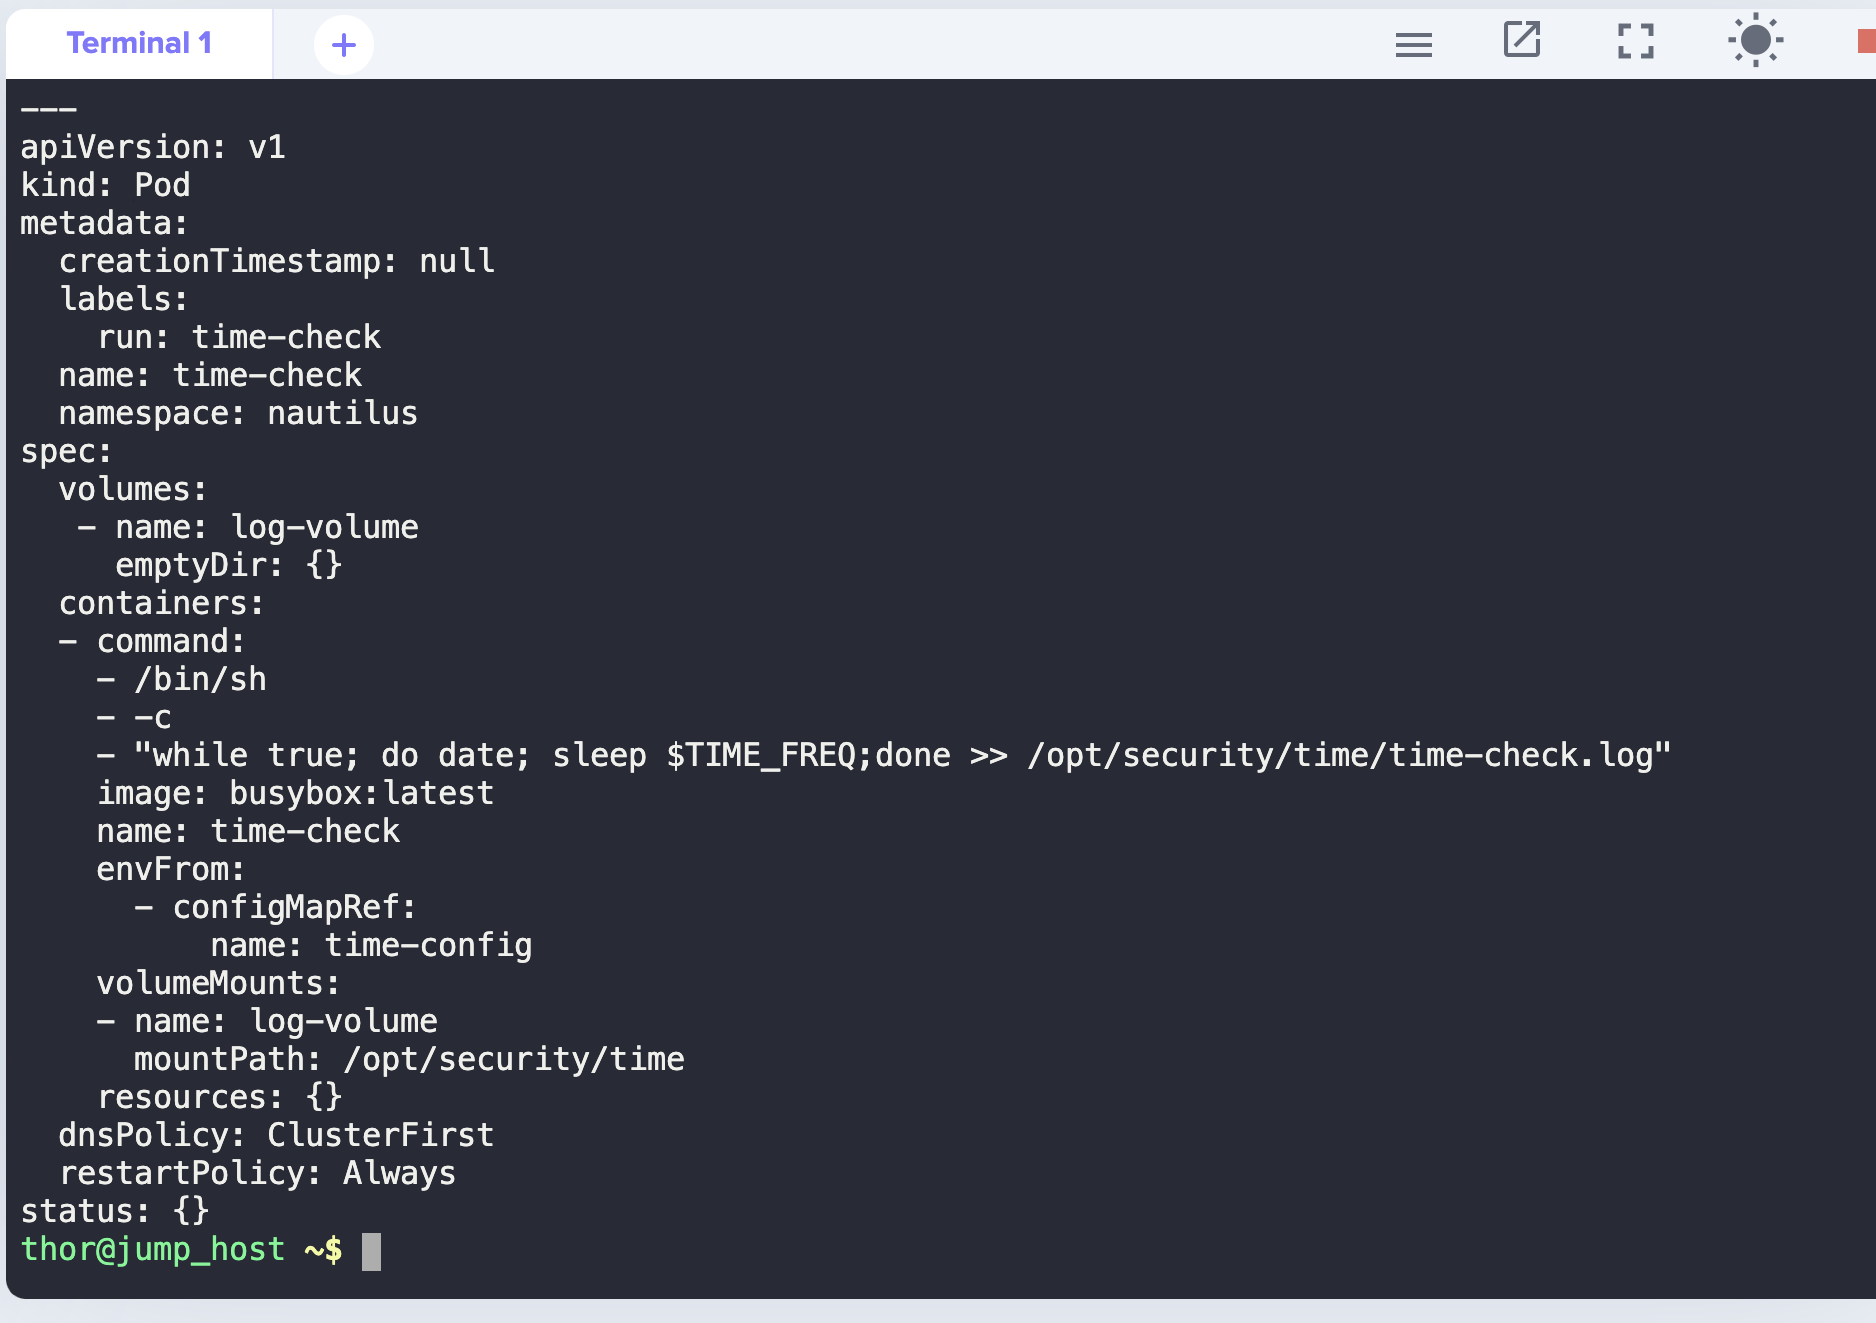
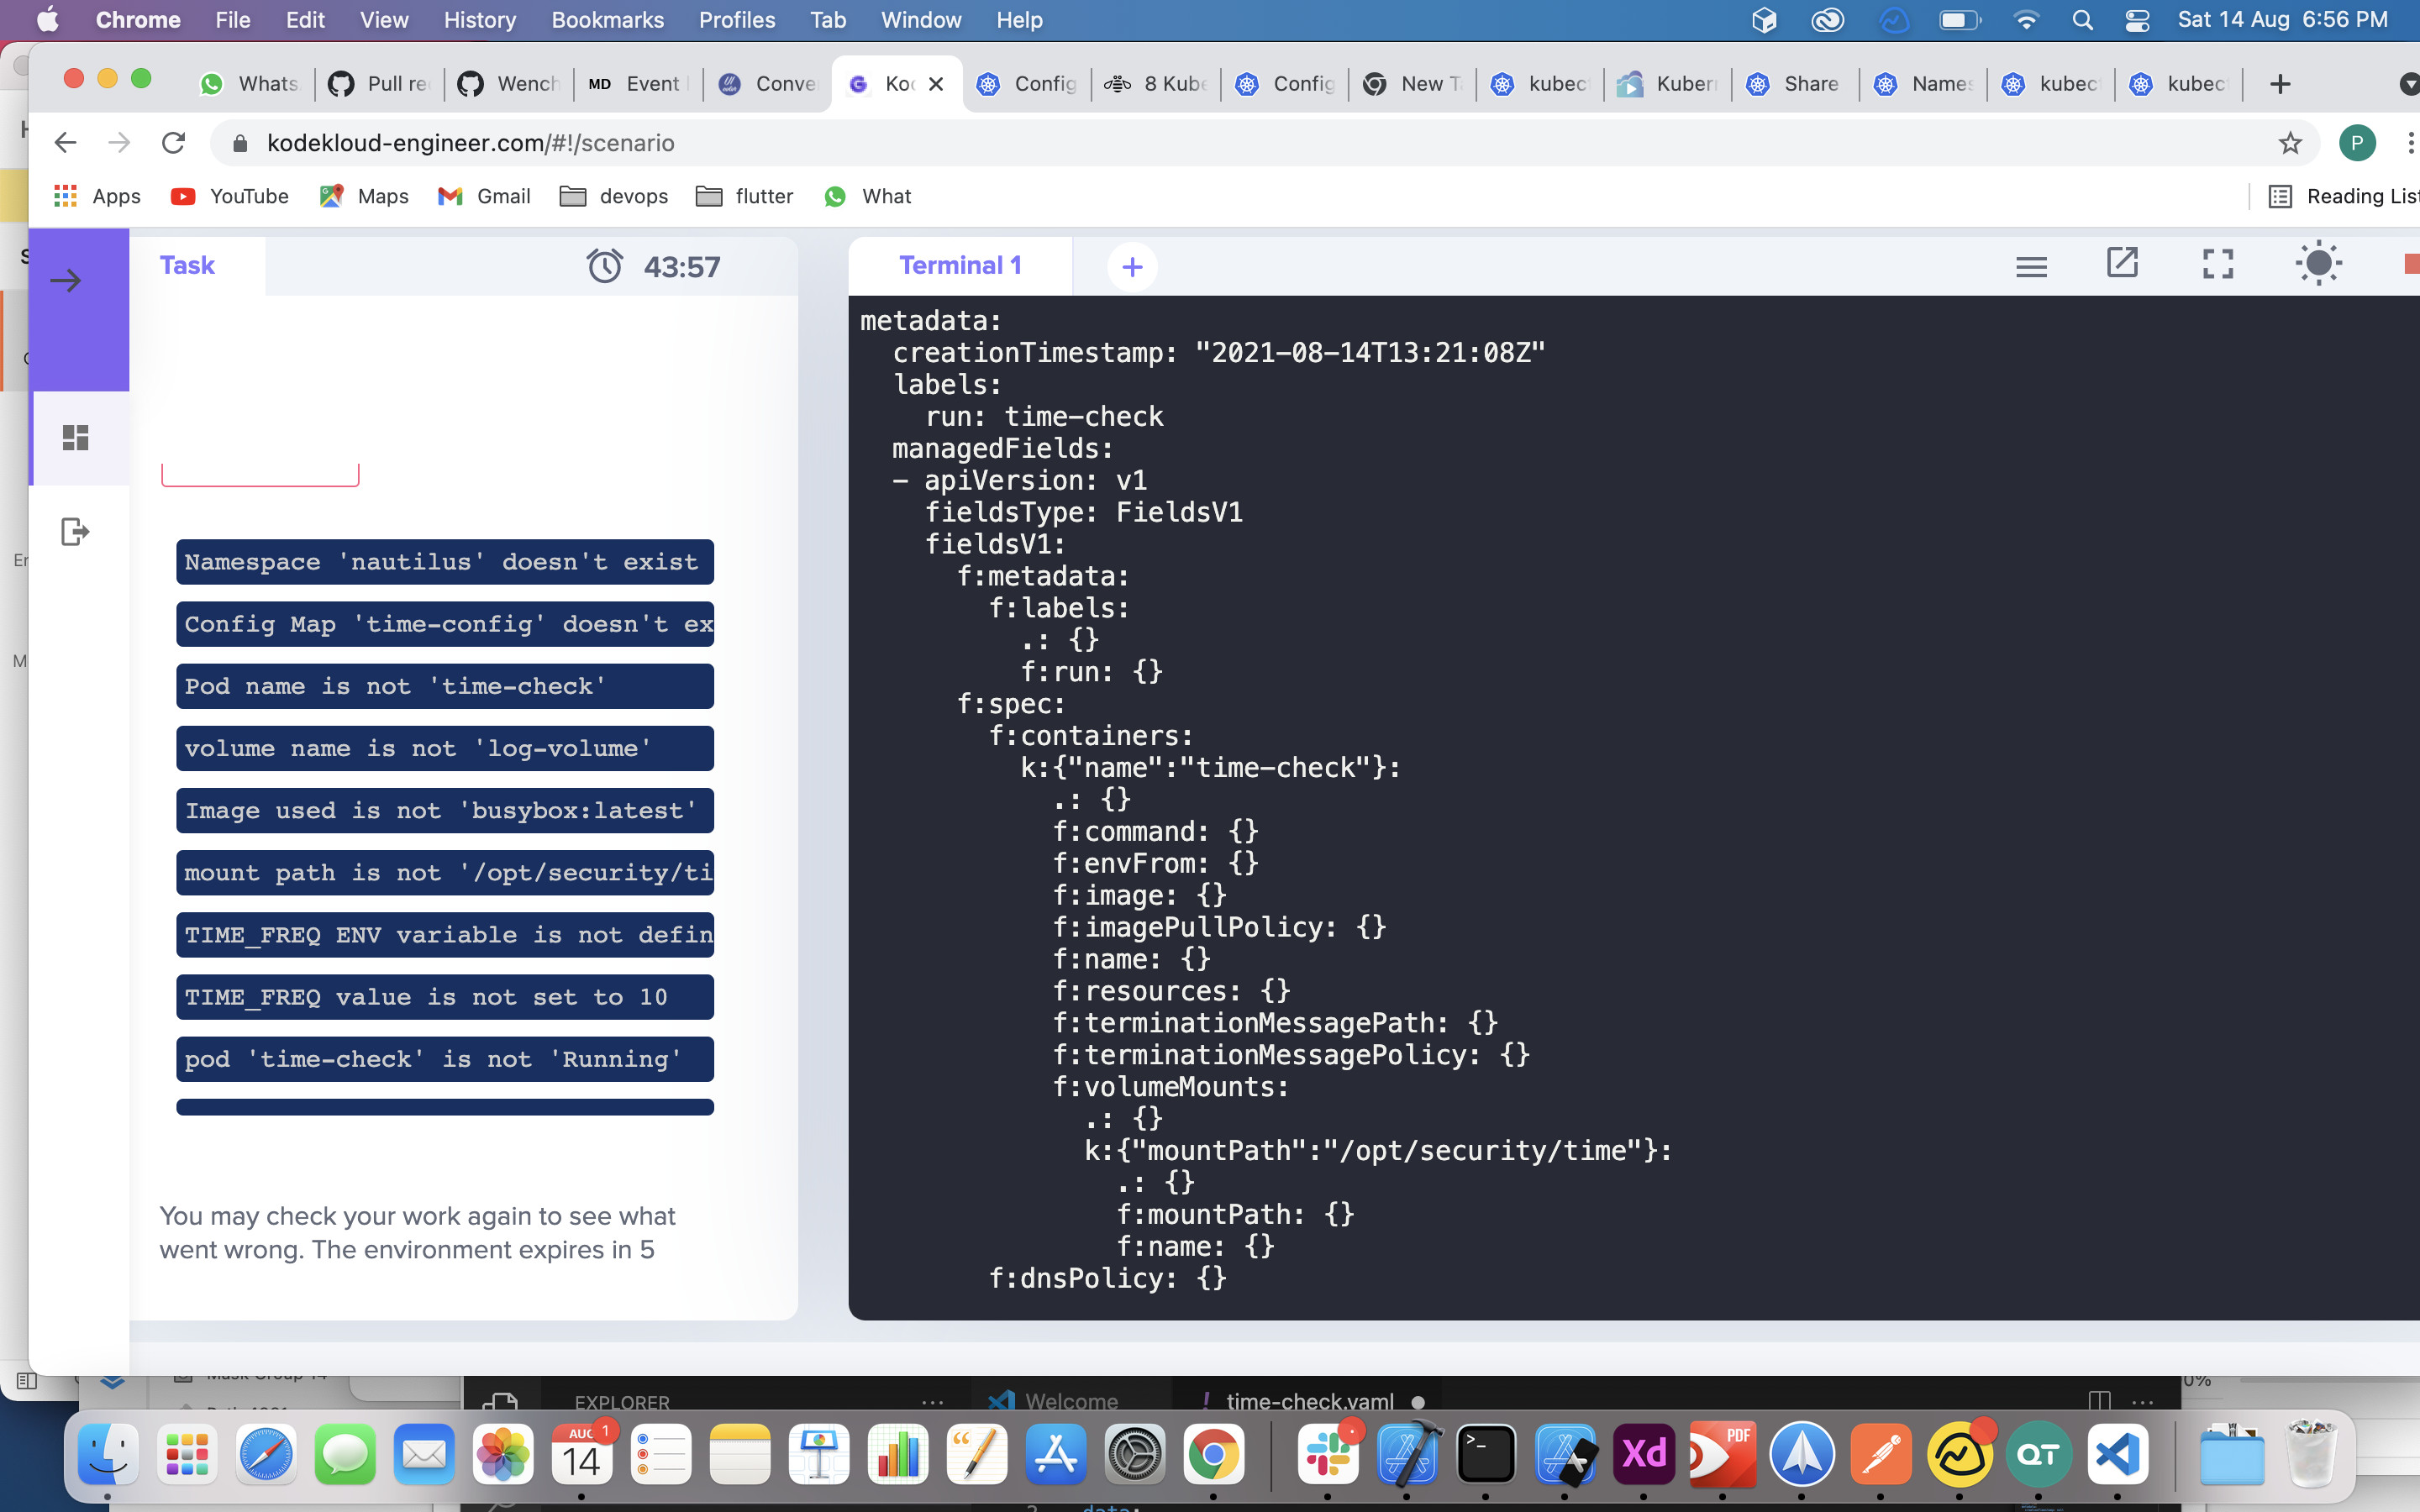
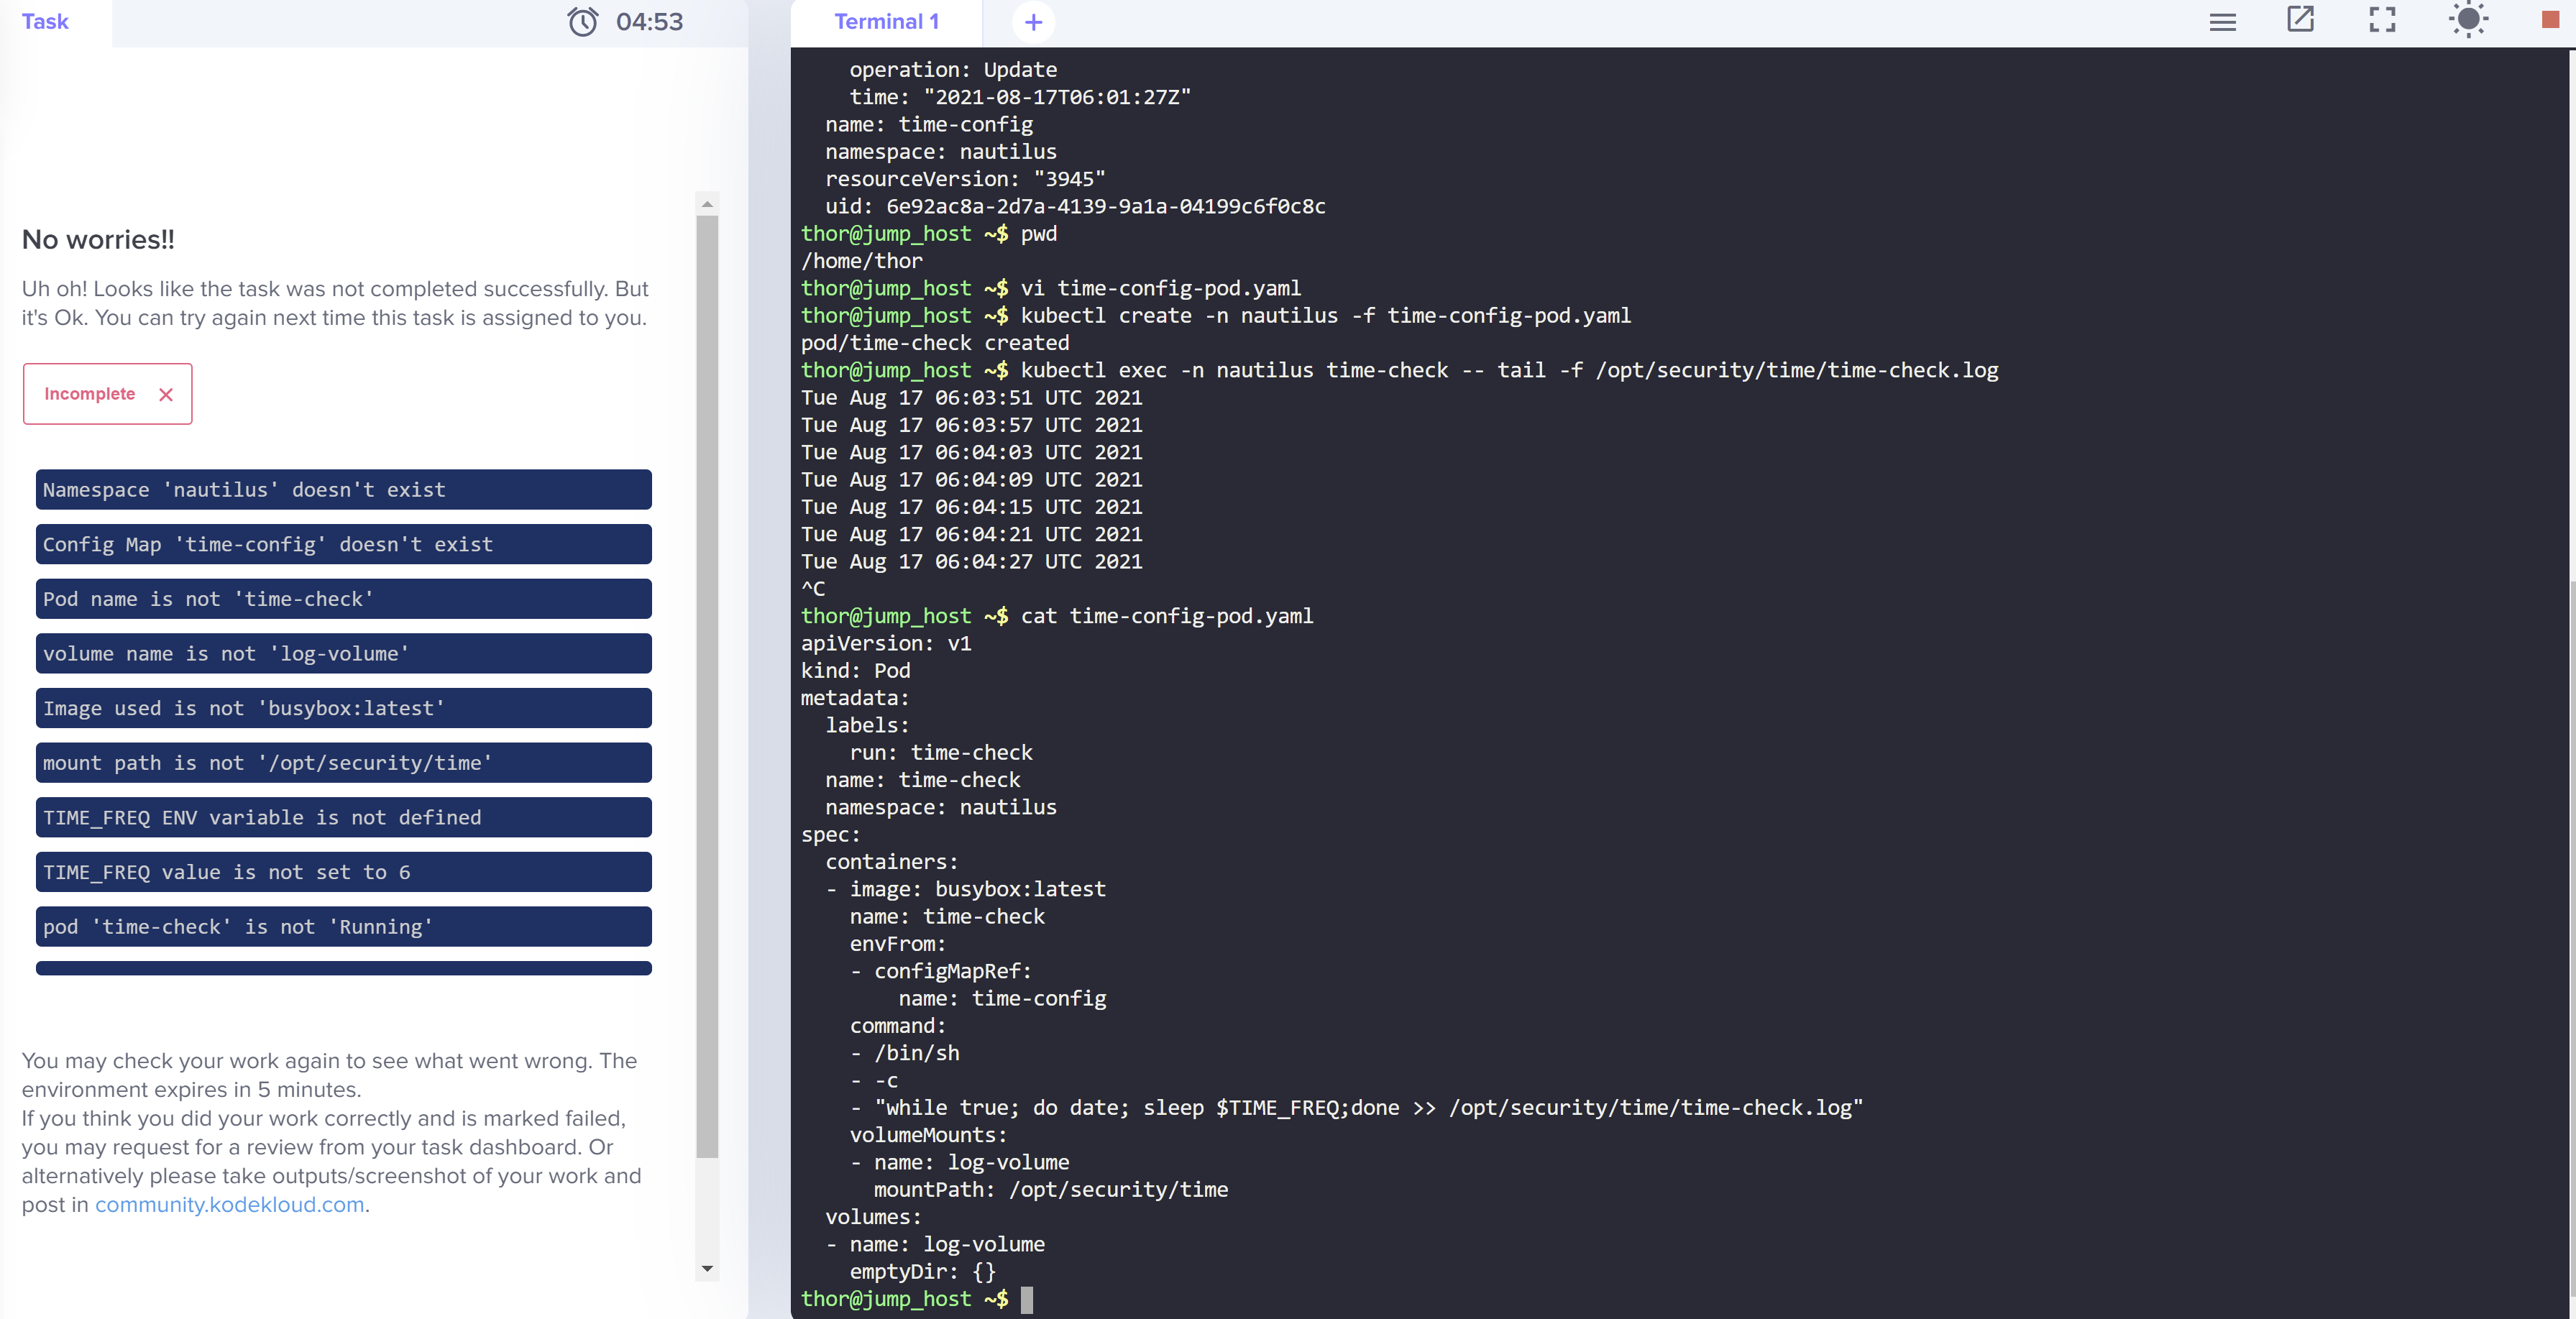
could you please check the same for me… It marked failed, though i have created a mentioned resources.
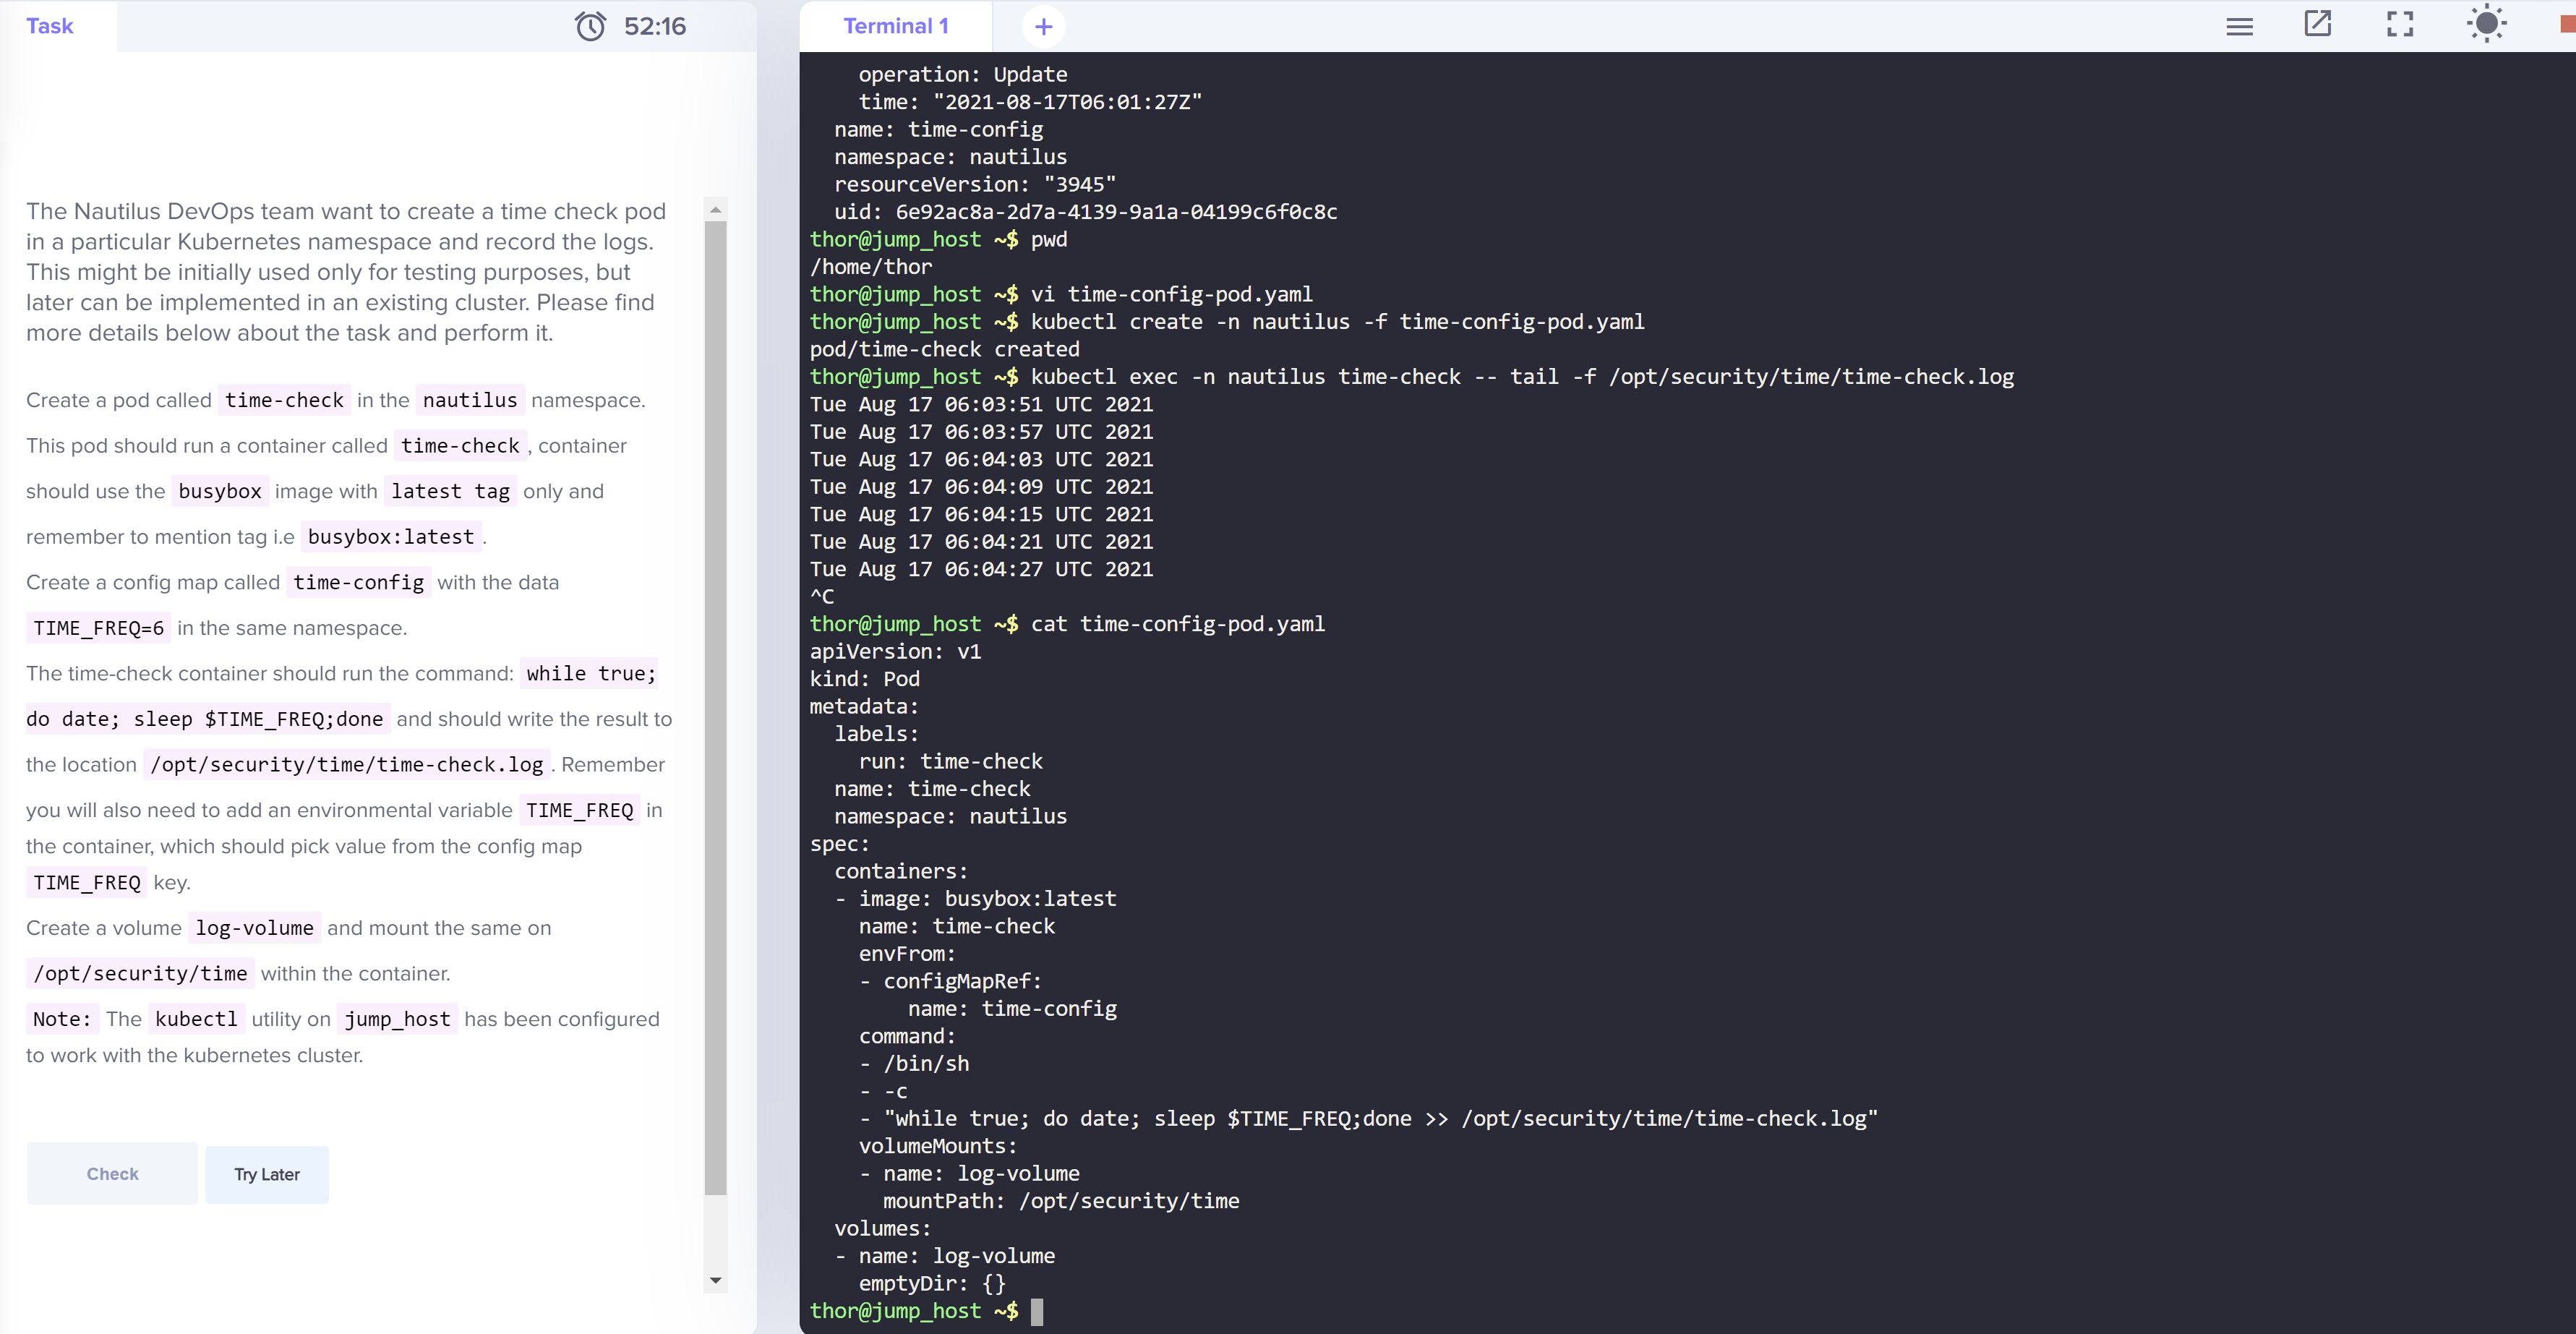
yaml file for config map and pod:
apiVersion: v1
data:
TIME_FREQ: 10
kind: ConfigMap
metadata:
creationTimestamp: null
name: time-config
namespace: nautilusapiVersion: v1
kind: Pod
metadata:
creationTimestamp: null
labels:
run: time-check
name: time-check
namespace: nautilus
spec:
volumes:
- name: log-volume
emptyDir: {}
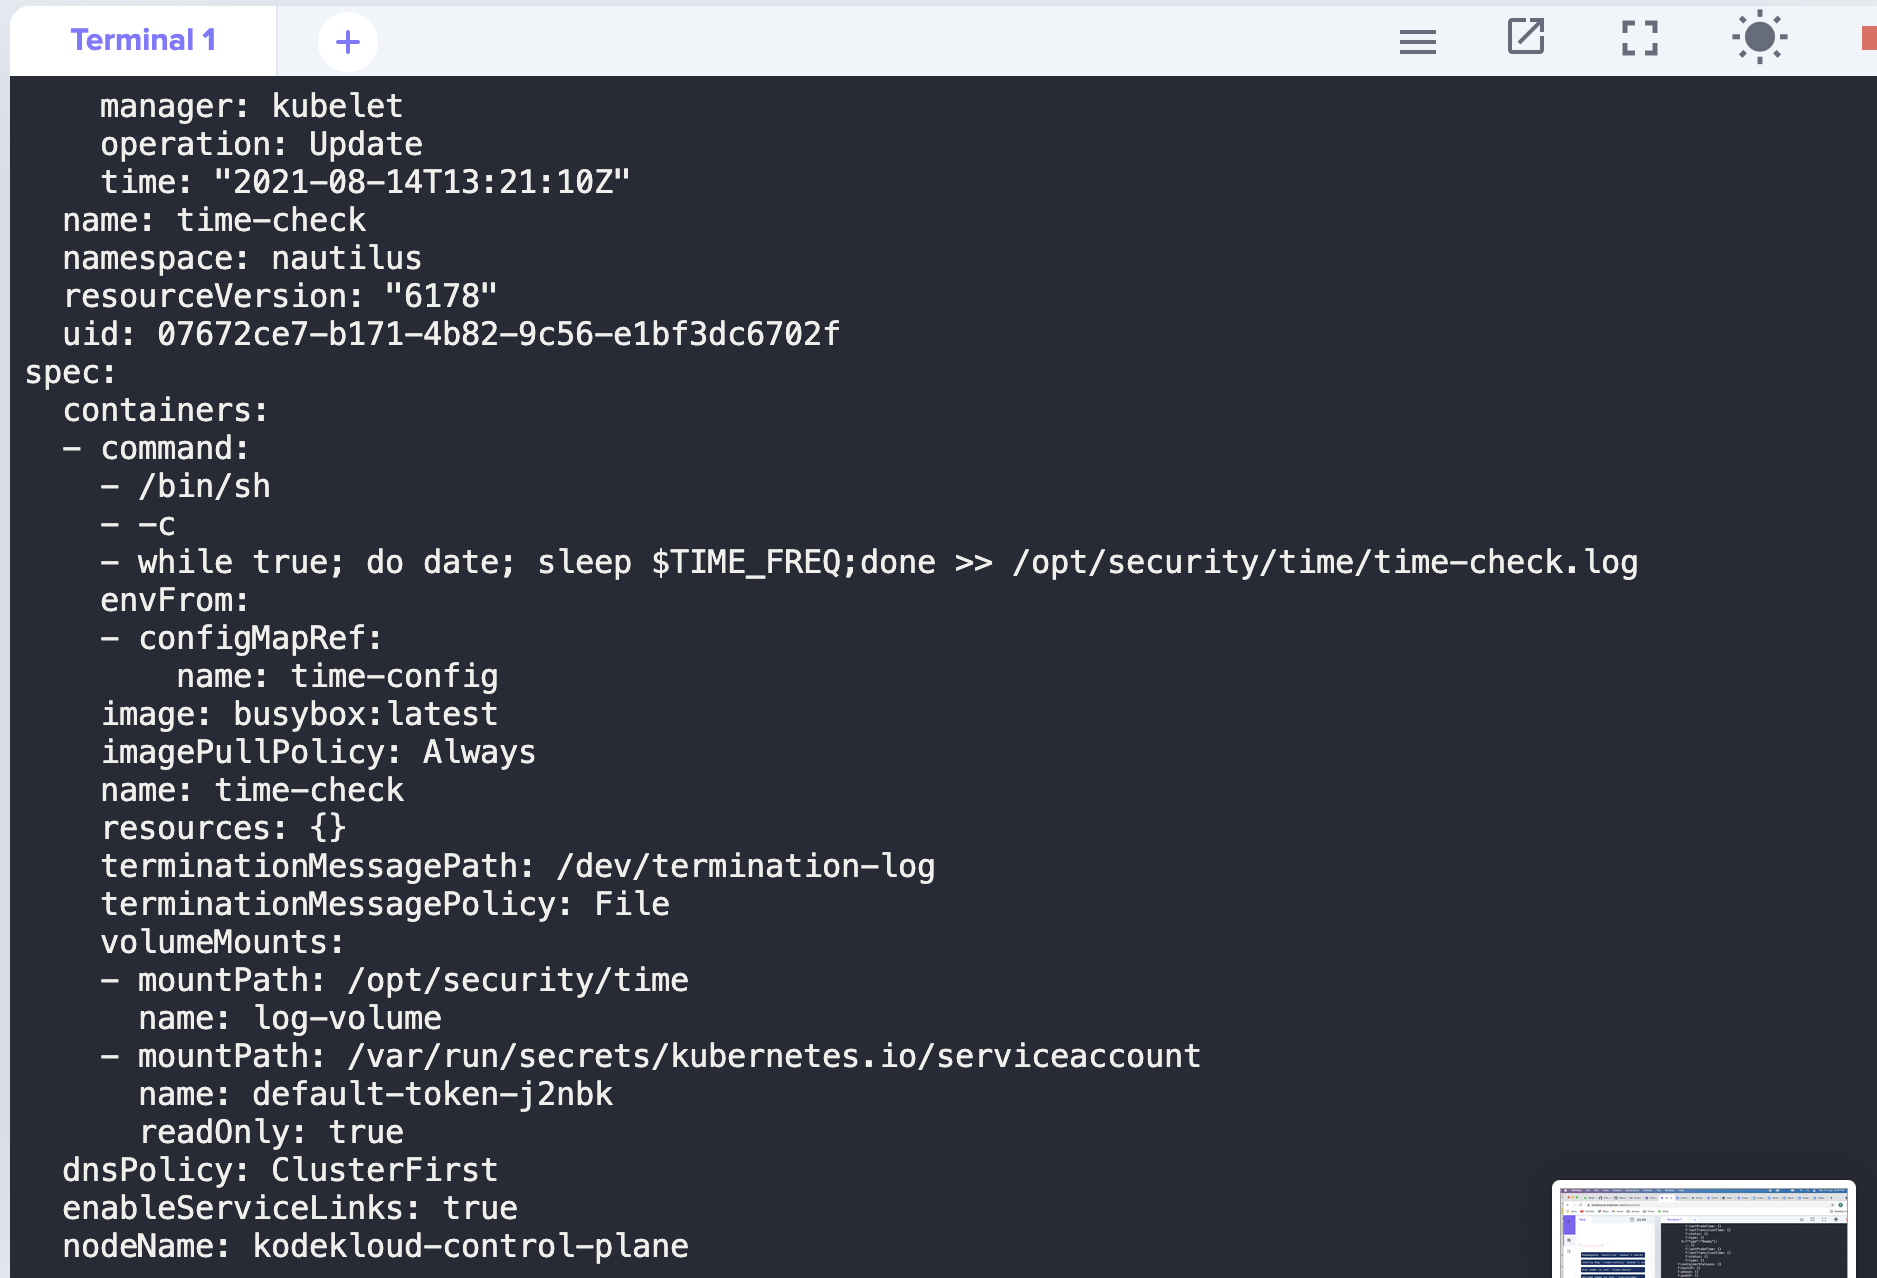
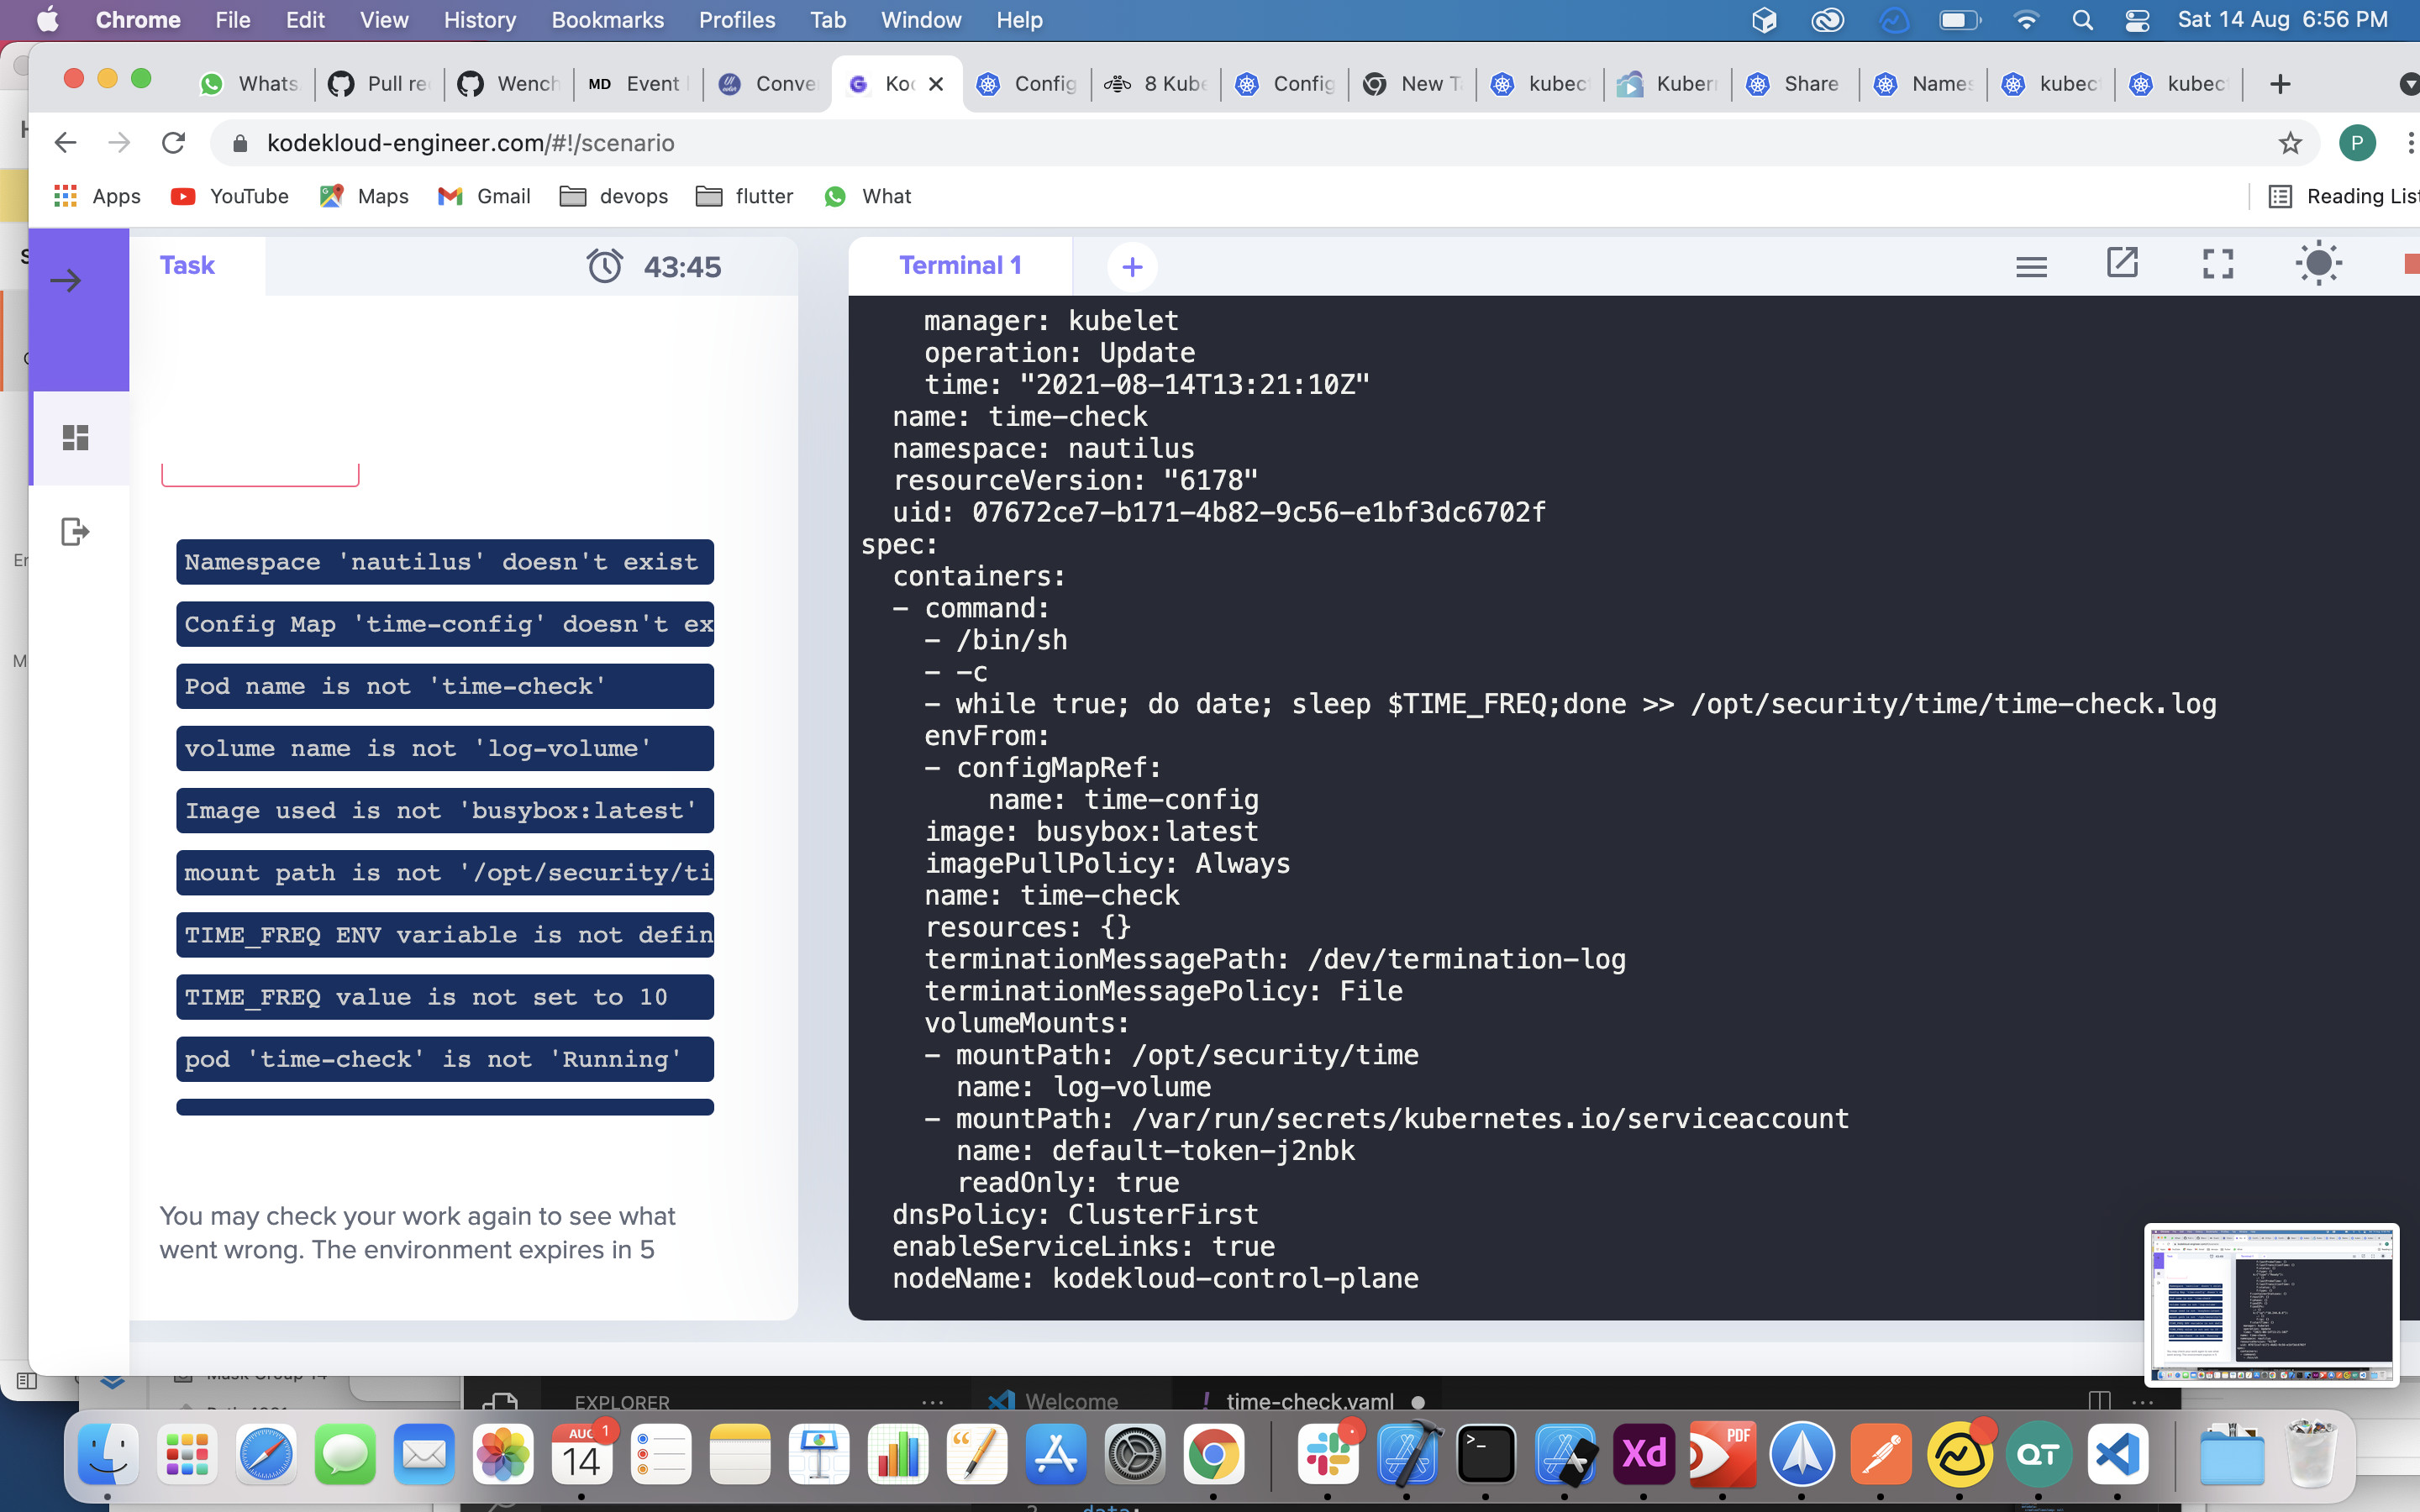
containers:- command:
- /bin/sh
- -c
- “while true; do date; sleep $TIME_FREQ;done >> /opt/security/time/time-check.log”
image: busybox:latest
name: time-check
envFrom:
- configMapRef:
name: time-config
volumeMounts:- name: log-volume
mountPath: /opt/security/time
resources: {}
dnsPolicy: ClusterFirst
restartPolicy: Always
status: {}
Hi @Inderpreet @rahul456
C’mon! It’s not fair! What’s happening with engineering? It’s the second time when happening to me. Please mark valid my job and recover my good works row.
Unfortunately the issue still exits, but we are trying to fix it asap. We will update once fixed.